Cost-Per-Case Calculator
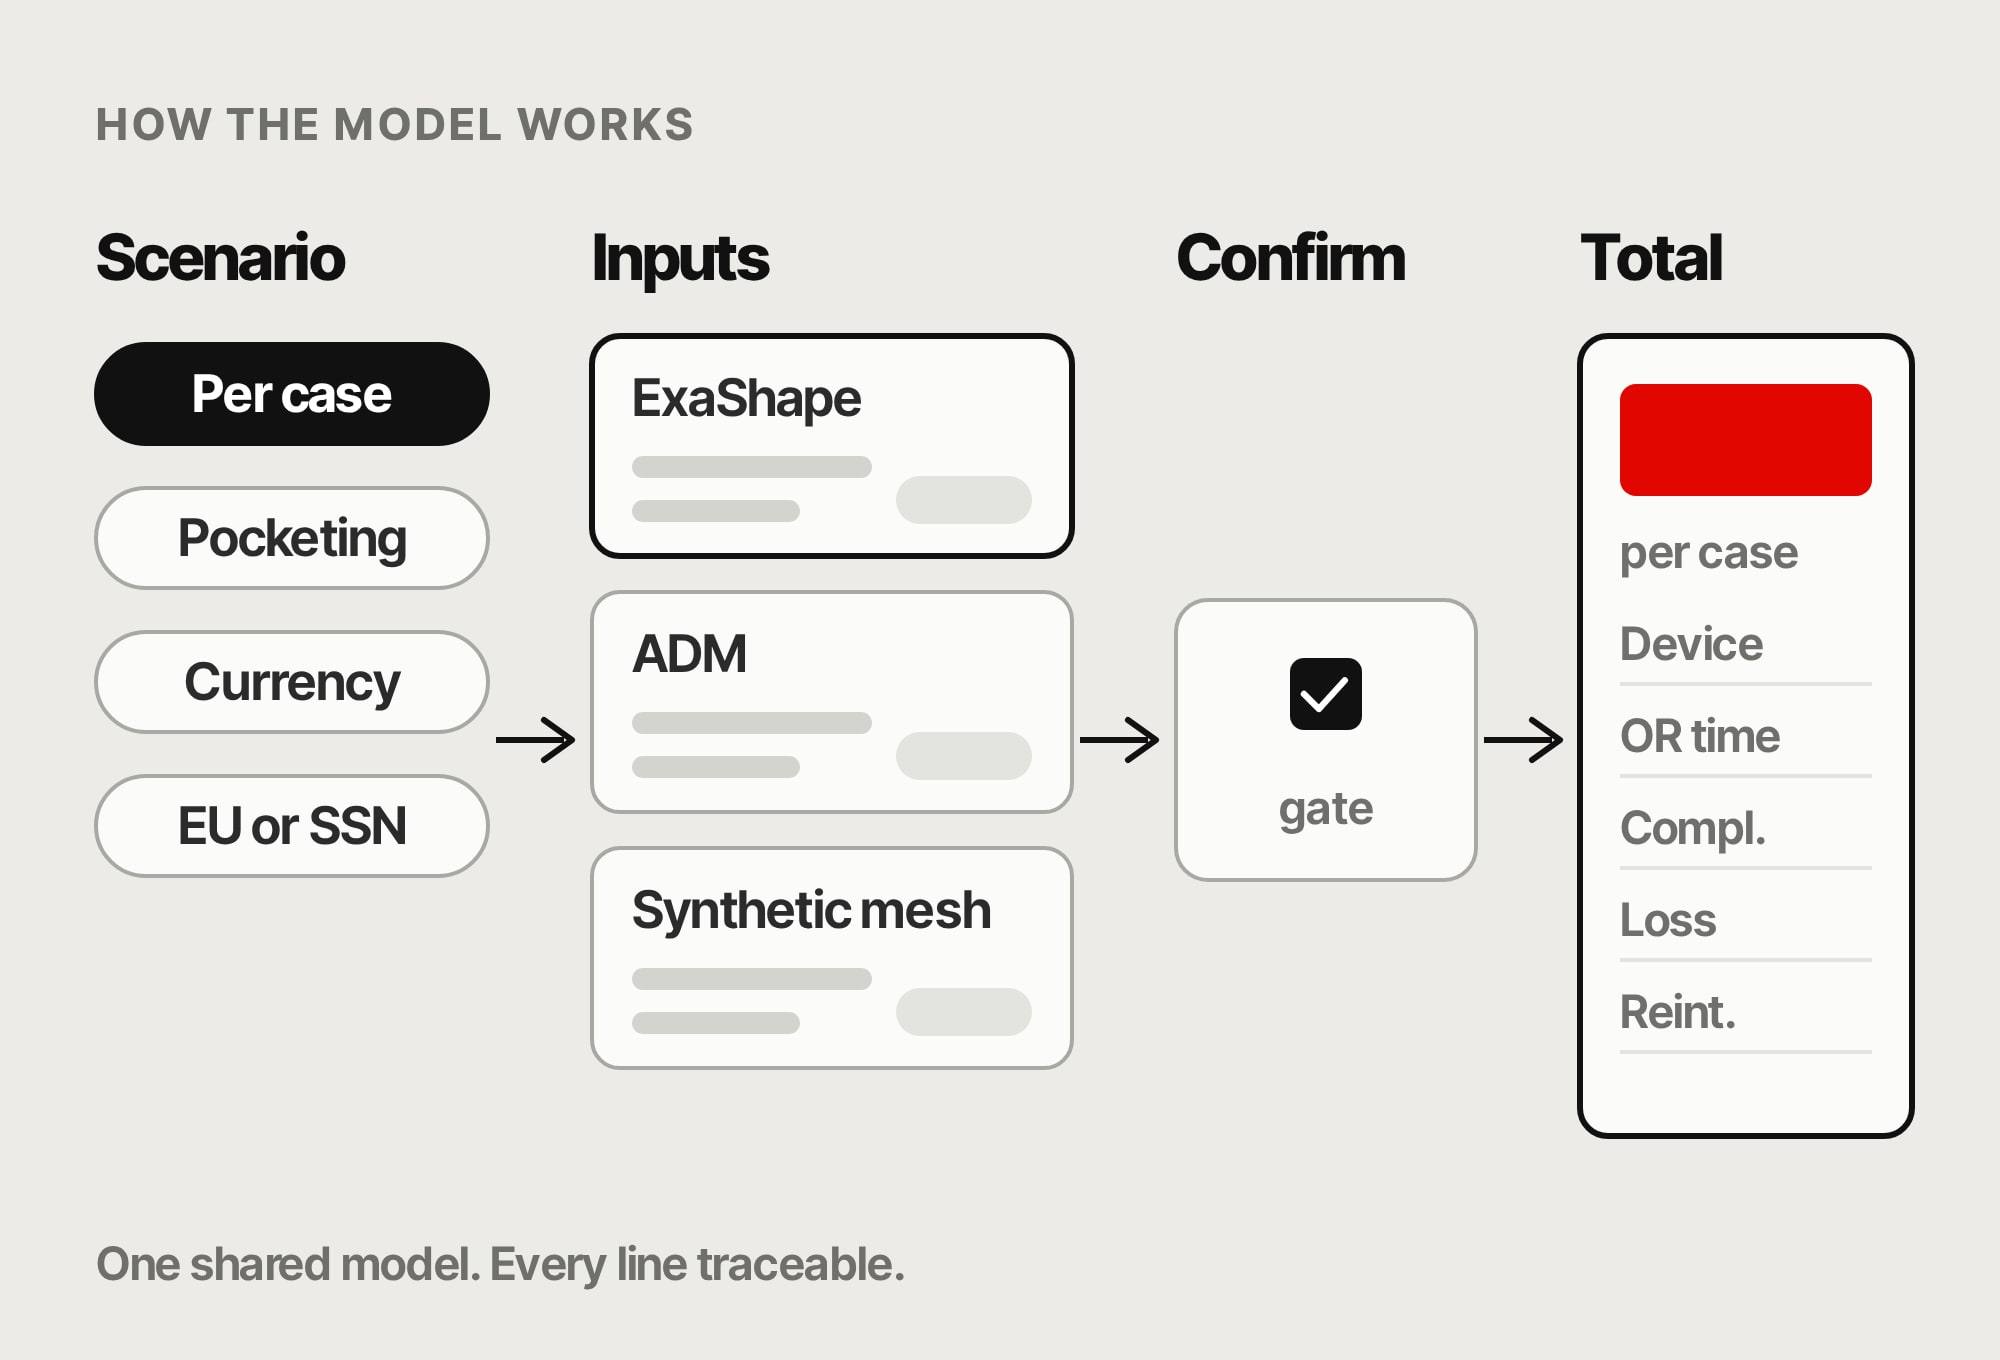
How the model works, as a wireframe.
One model that turns ExaShape versus ADM and synthetic mesh into a clear cost of case, not a device price alone.
Designed by me, built with a little help from AI, for Advanced Biomedical Concept. 2026.
Problem.
Device price alone is the wrong number. OR time, complications, implant loss and reintervention move the total. Spreadsheets differed by who owned them. The team needed one shared model.
Craft.
Who it is for.
ABC's commercial team and representatives. Anyone who has to explain, with discipline, why ExaShape can cost less than a cheaper mesh once the full case is counted.
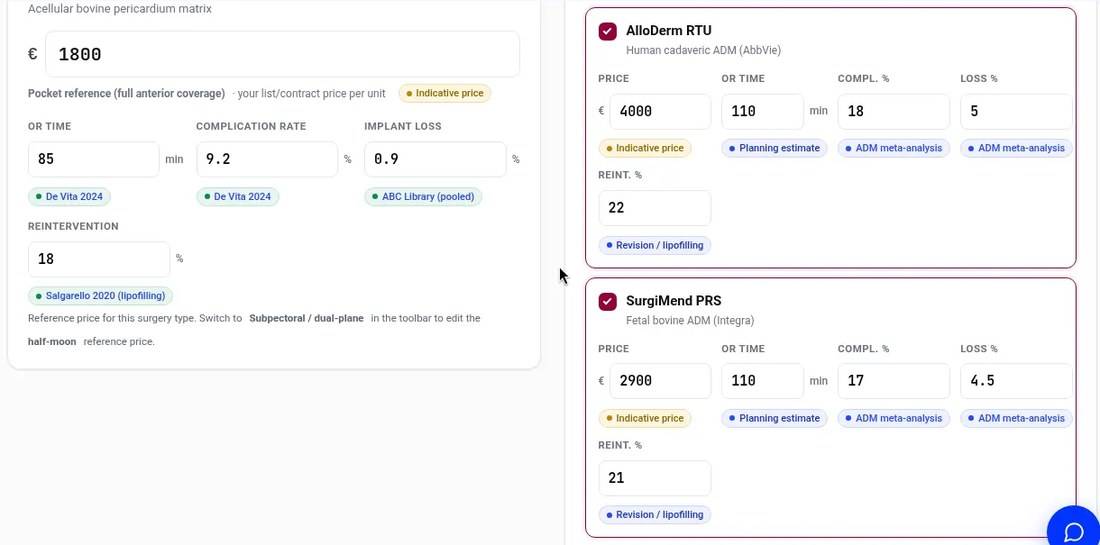
Inputs for a prepectoral case, live for ABC's team. Set the scenario.
Toolbar first: per case or annual volume, pocketing approach, currency, and EU or Italian SSN environment. Same starting point for every conversation.

Step 1. Lock the scenario before you touch prices. Enter the inputs.
Product price, OR time, complications, implant loss and reintervention for ExaShape against ADM and synthetic mesh. Sensitivity toggles and laterality keep the model honest.
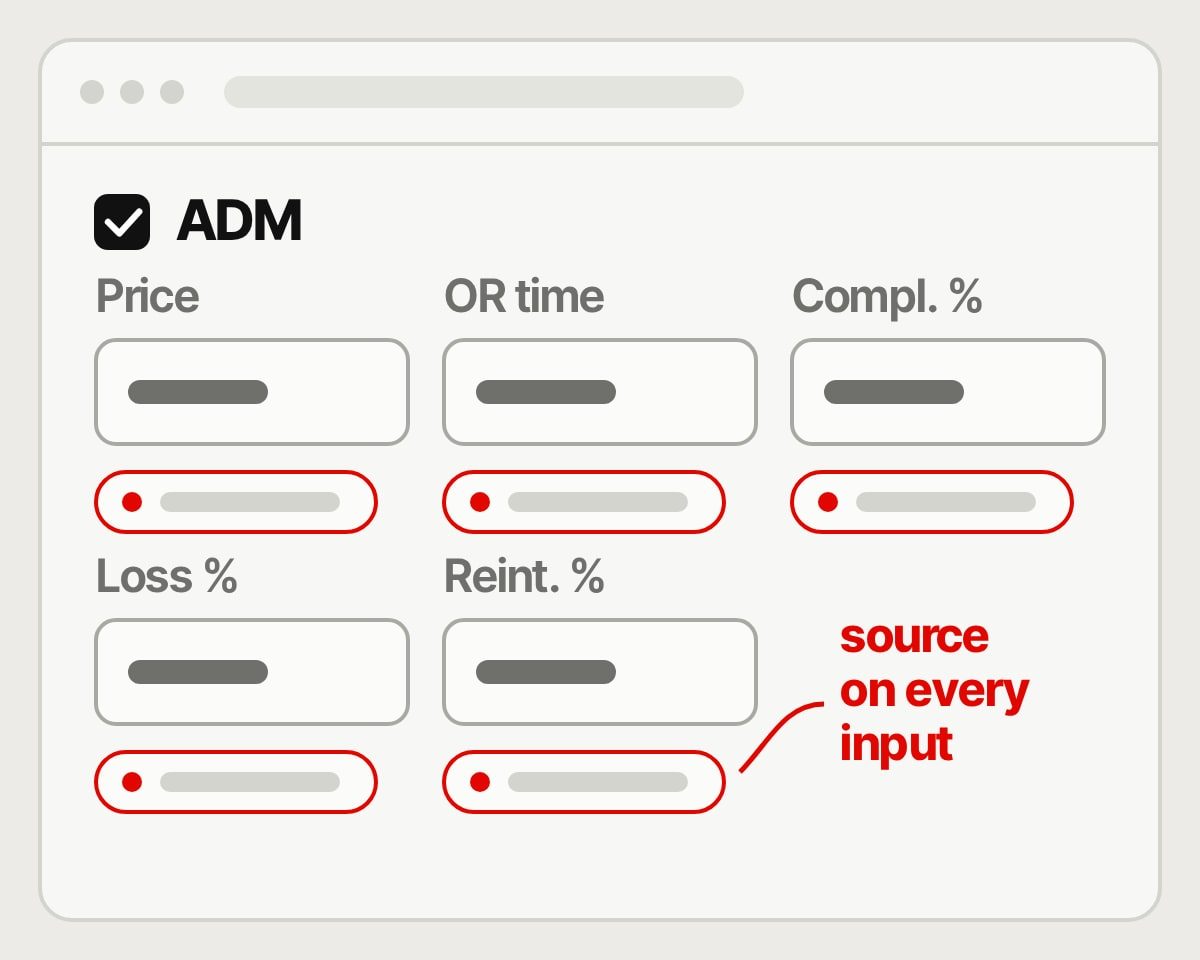
Every input carries its source. 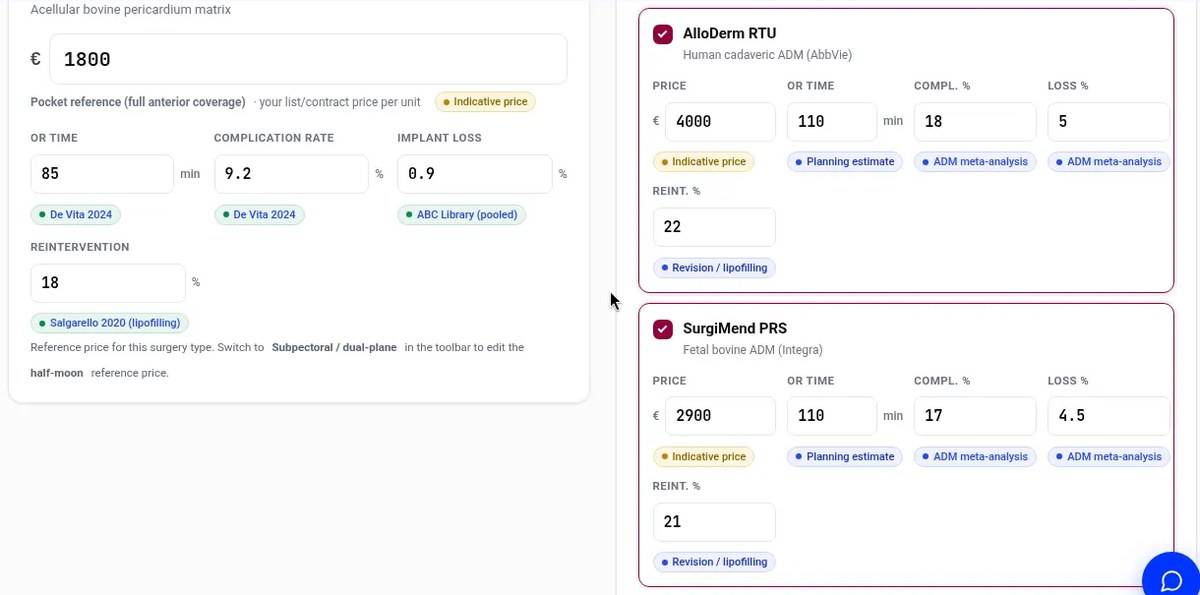
Step 2. The numbers that feed the model. Confirm, then see the total.
Results stay behind Confirm before viewing results. No accidental reveal mid-meeting. The output is a case total, not a quote.
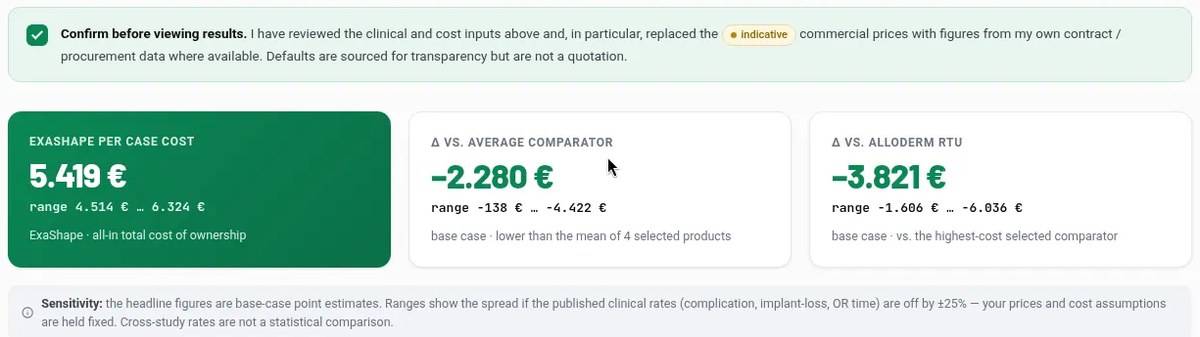
Step 3. Confirm. Then the totals. Where the total comes from.
A breakdown shows each cost line so the economic argument is transparent. Change an input, reconfirm, and the story updates.
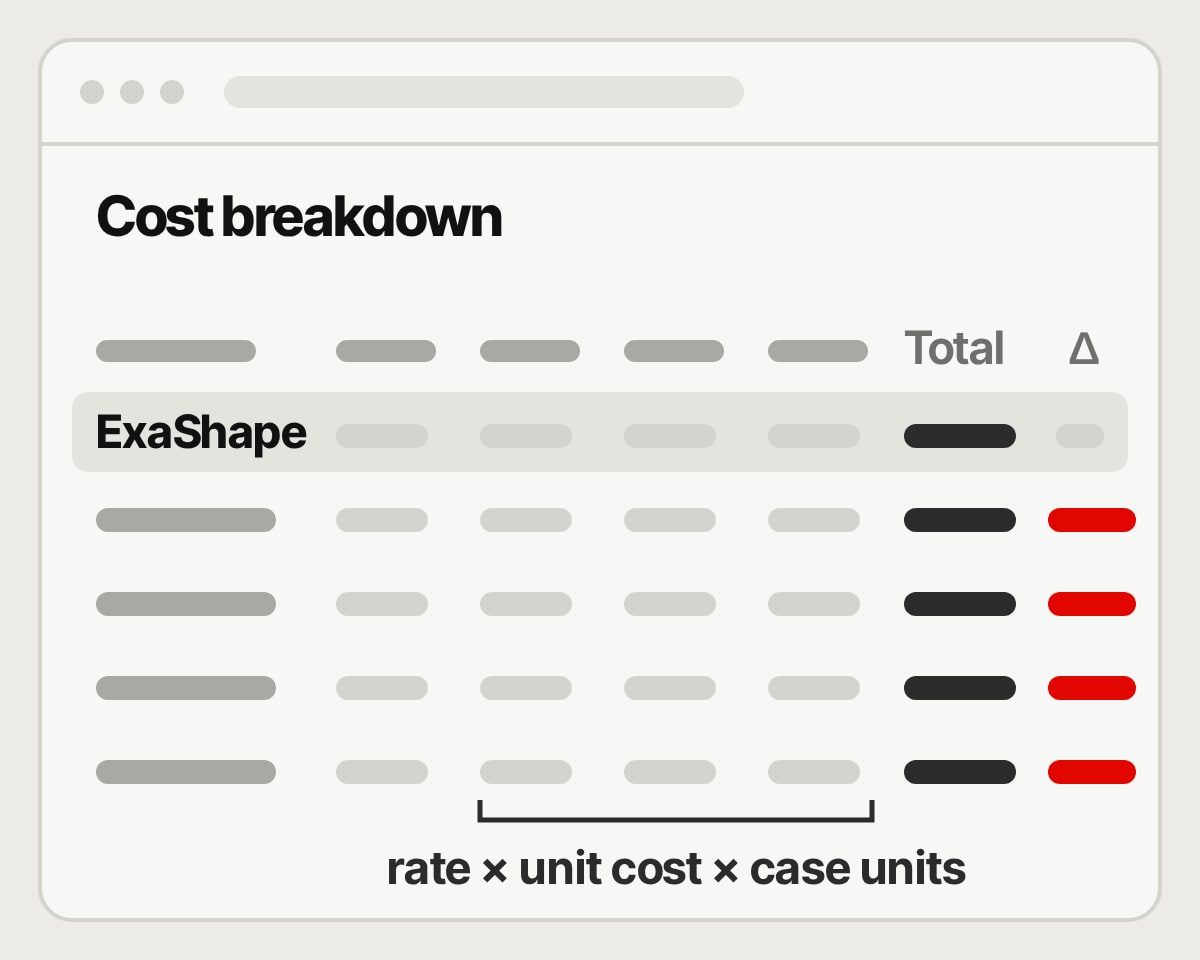
Expected costs: rate × unit cost × case units. 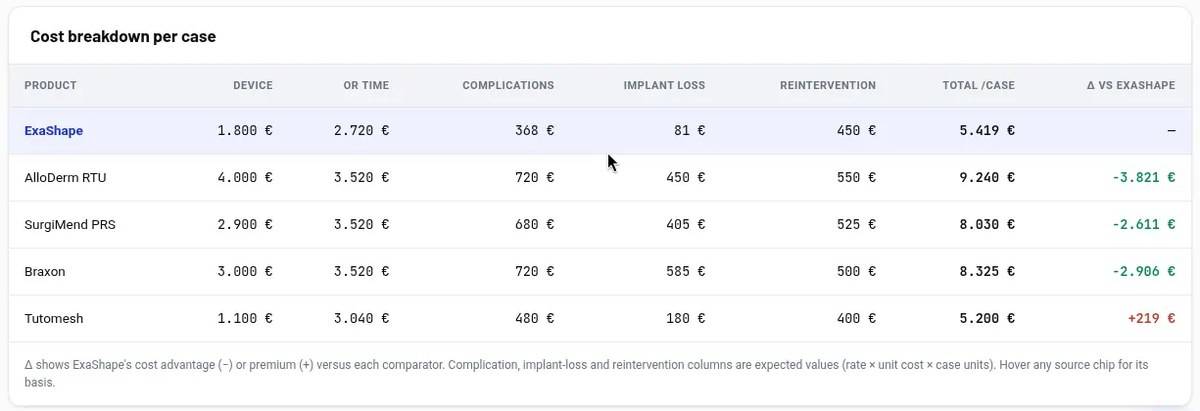
Step 4. The calculation, line by line. Why shipping it matters.
I own the site and its builds, so an internal decision tool is a page, not a project. Same design system as the public site. One model, one answer, no spreadsheet drift.
A full pass through the flow.
Outcome.
Live for ABC's team and representatives. One model, one page, with a confirm step before results.